“What are the SNPs or variants that are shared in common between two VCF files I created (e.g. from different SNP discovery pipelines, or two treatments of an experiment)?”, you might ask.
Below, I provide a post based on my recent answer to this ResearchGate question that provides some solutions for this problem.
First, the vcftools --diff <filename> --diff-site option would work for this specific case. This option for the --diff flag is listed in the documentation as having the following function:
“Outputs the sites that are common / unique to each file. The output file has the suffix “.diff.sites_in_files”.”
To mention other options, bcftools is supposedly faster at this, and if you use bcftools what you want is the intersection function, isec. On mac or Linux with bcftools installed, you could use something like the following (where $ is the command line prompt) to get the list of SNPs at the intersection of two or more VCF files:
$ bcftools isec -n +2 file1.vcf.gz file2.vcf.gz | bgzip -c > isec_file1-v-2_out.vcf.gz
Alternatively, if you wanted just statistics on the numbers of SNPs/variants or genotypes in common between files, you could use the vcf-compare tool that comes with vcftools. See the documentation here.
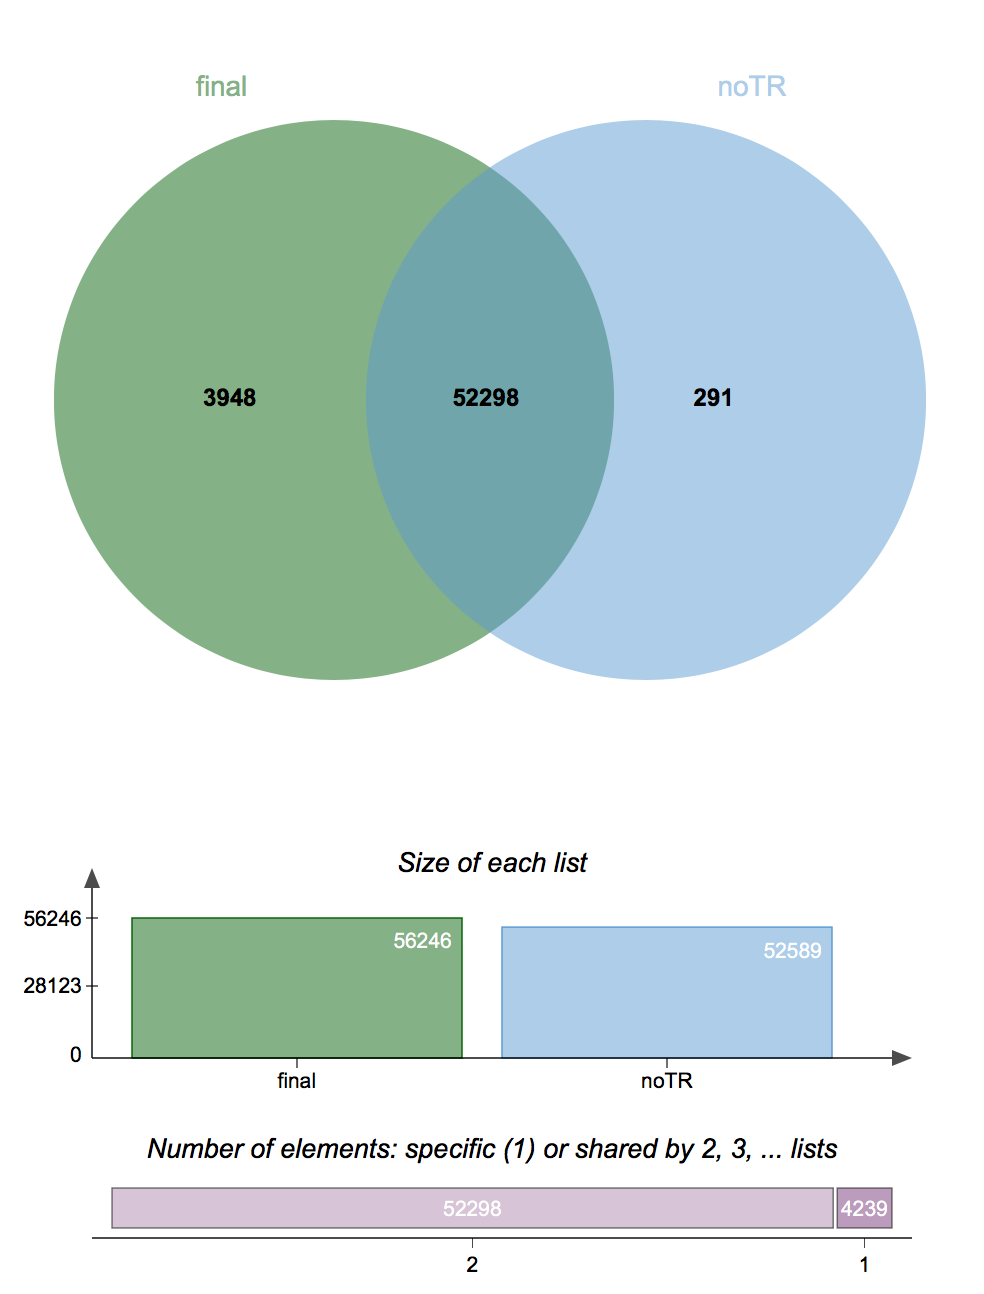
Once you had the output of running these programs in hand, it would then be possible to do a number of things, such as report common/different SNPs between runs or treatments, conduct statistical anlaysis, or create a Venn diagram of common/different SNPs between multiple VCF files to visualize the differences. Personally, I can validate this by saying that I recently ran vcf-compare and bcftools isec (as per above) and used the results to generate a Venn diagram with jvenn, shown below:

This is showing a comparison of the VCF file from the original SNP discovery analysis for one dataset, and a second run of the SNP discovery pipeline on the same dataset, but with technical replicates removed (blue). Results are 99.4% similar, and the classical Venn helps us visualize the very minute difference between these results.
Hope this helps someone.
~J